StepOut
The Numbers Behind an Effective Press
Tactical Analysis

The Numbers Behind an Effective Press

Why Some Teams Win the Ball Back Faster

PPDA – The Pressure Meter
PPDA – The Pressure Meter

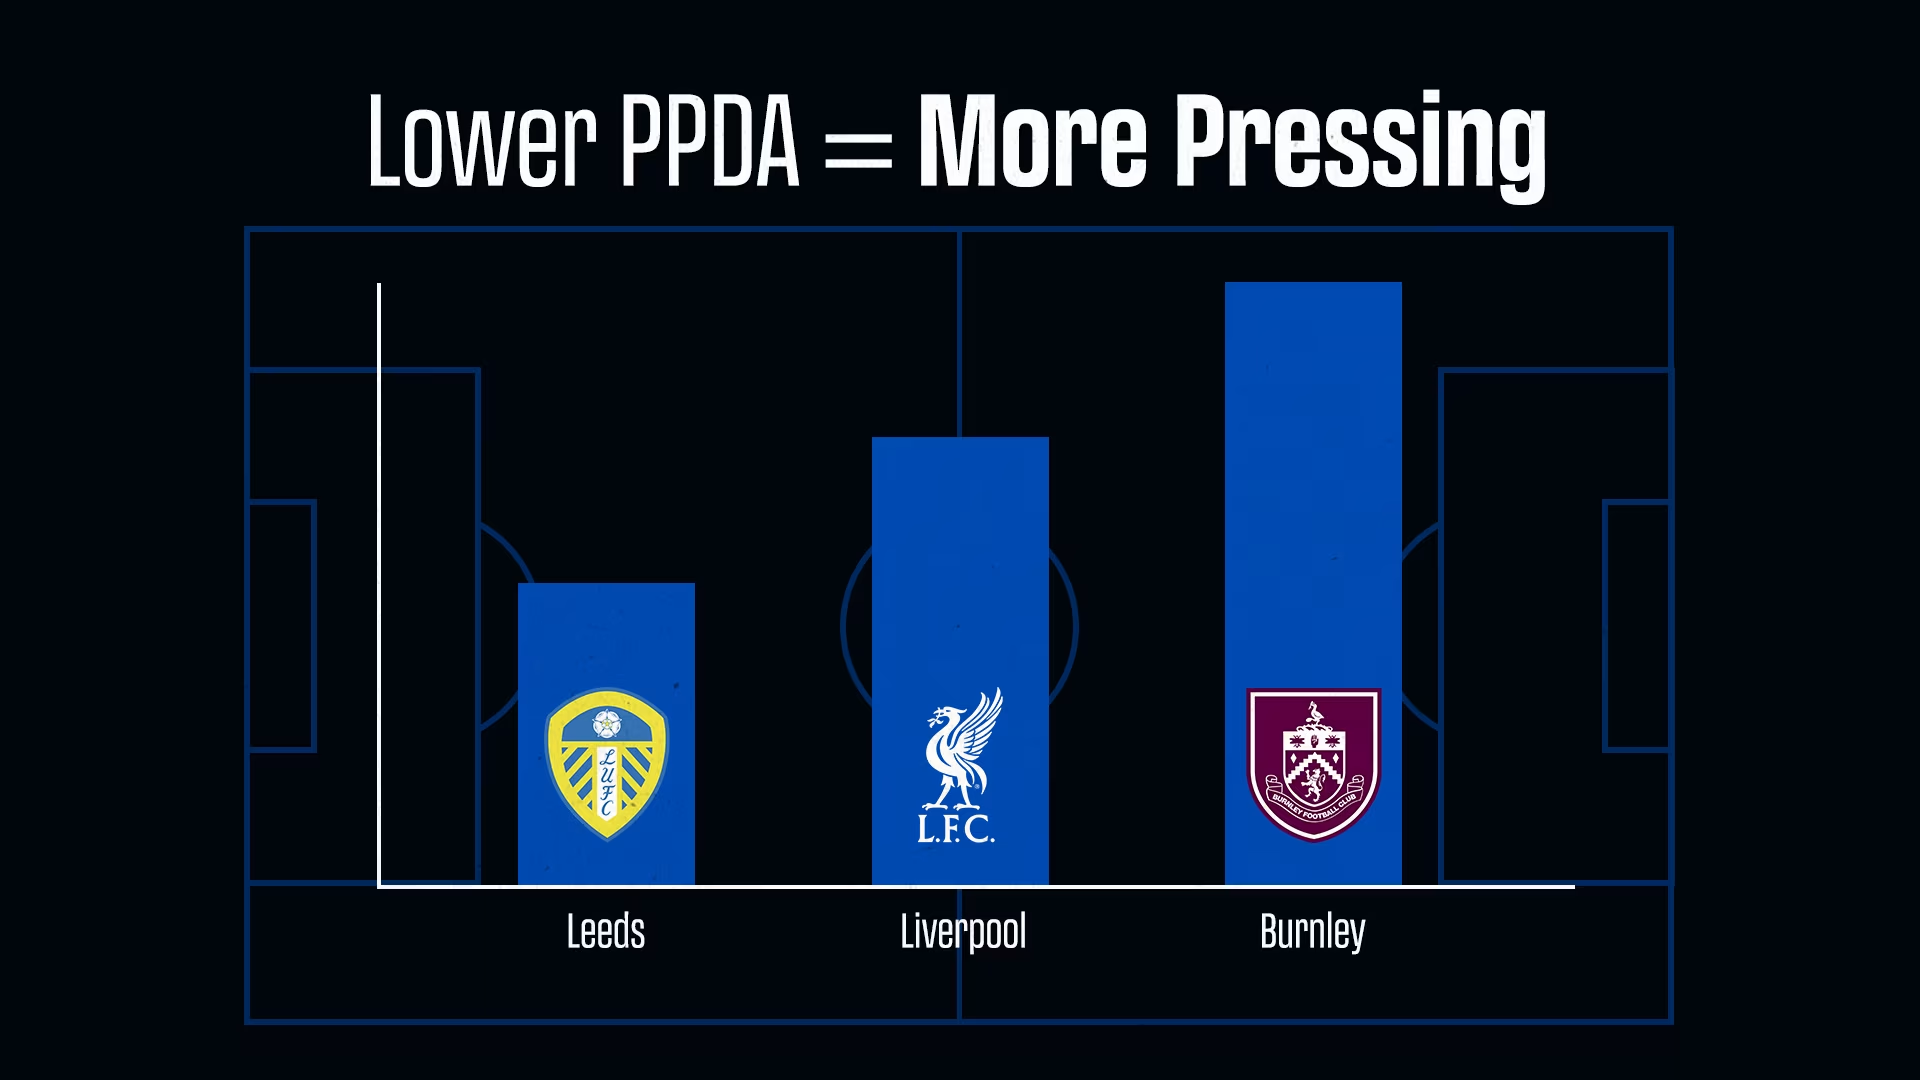
Passes Per Defensive Action (PPDA) tells you how many passes a team allows in the opposition’s half before they step in with defensive pressure. A lower number means more aggressive pressing.

Leeds under Bielsa once averaged just 8.1. Liverpool hovered around 10.2. Burnley and West Ham? Often above 16. That difference reveals mindset. Low PPDA teams want to win the ball back fast. High PPDA teams are more about structure and containment.

High Turnovers – The Threat Multiplier
High Turnovers – The Threat Multiplier

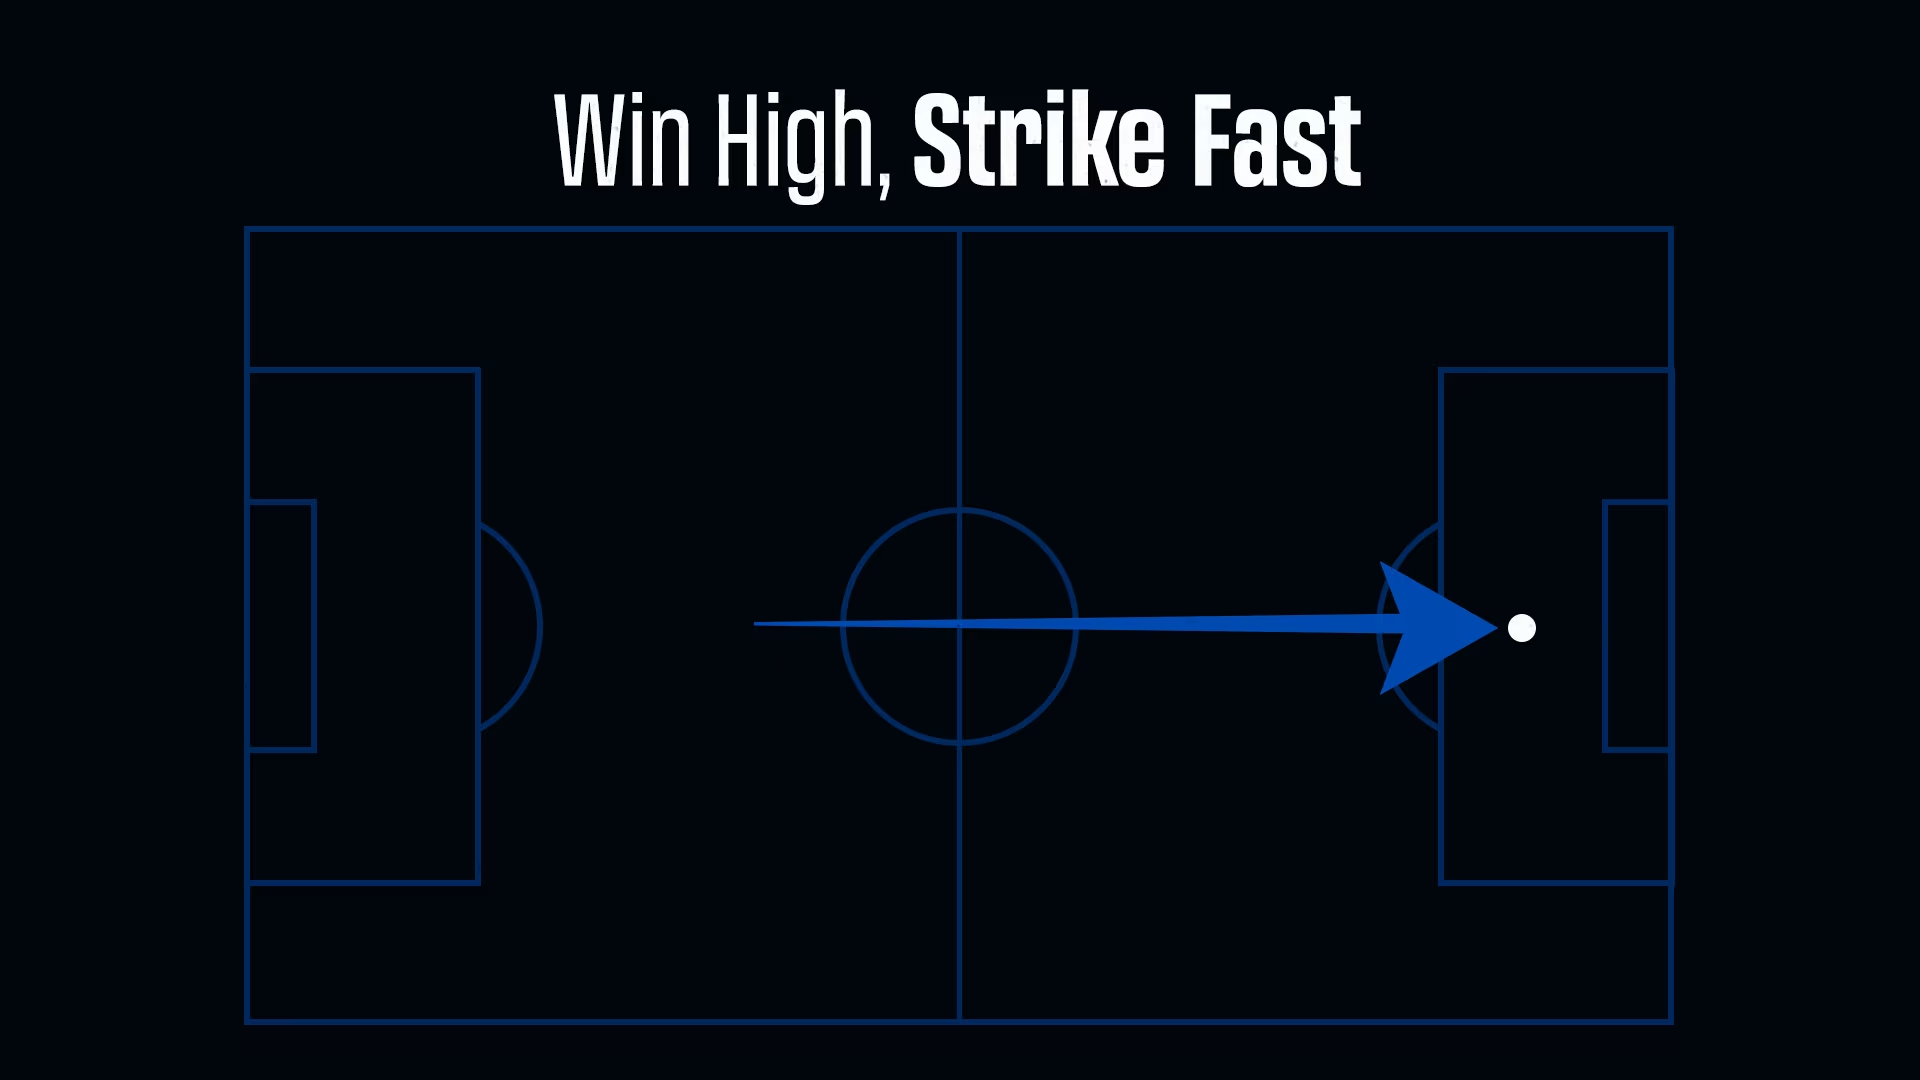
Winning the ball is one thing. Winning it high up the pitch is another. High Turnovers track how often a team regains possession close to the opponent’s goal—and what they do with it.

Manchester City, in their title-winning 2022–23 campaign, averaged 12.7 high turnovers per match—and turned 30% of them into shots. This is pressing with purpose. Not just disrupting play, but converting pressure into chances.

Sprint Intensity – The Hidden Weapon
Sprint Intensity – The Hidden Weapon

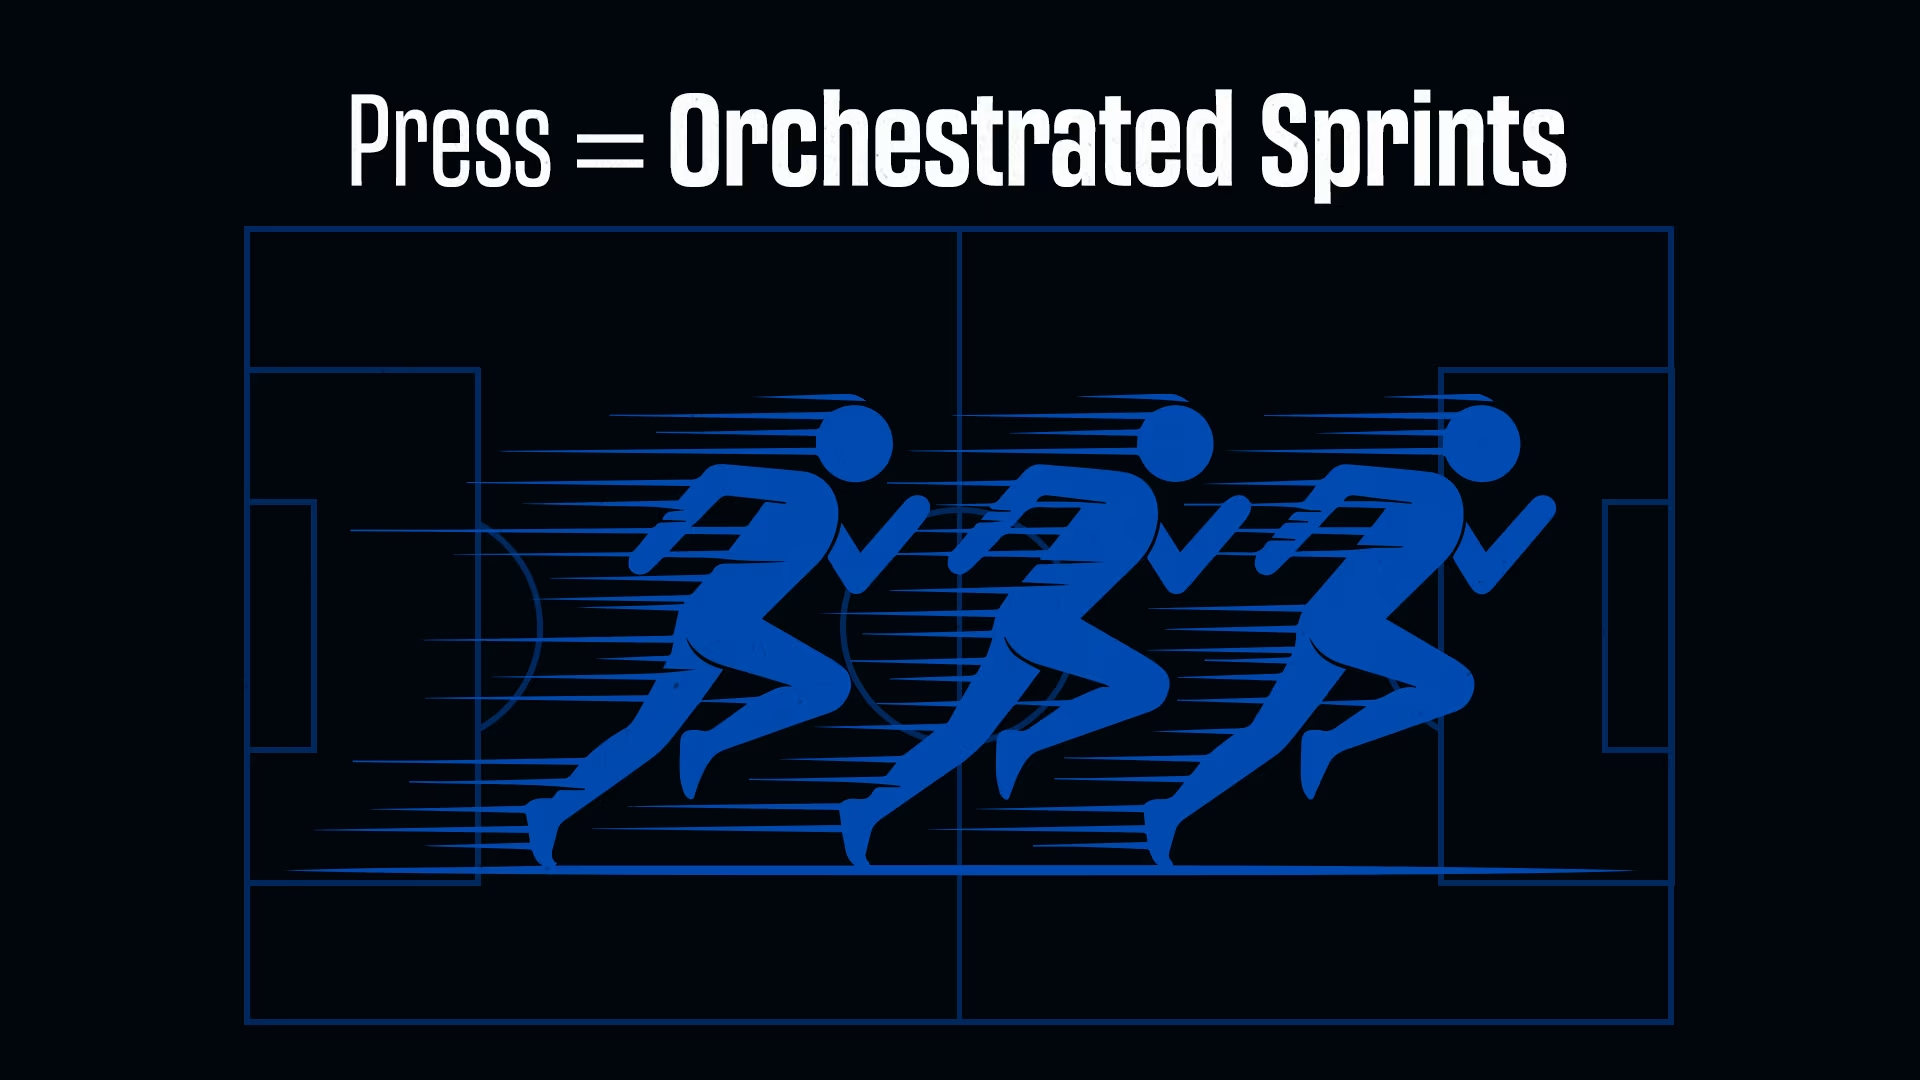
Pressing isn’t just about running more. It’s about running right. Sprint Intensity looks at how many high-speed efforts a team puts in per match—and when they do it.

According to UEFA’s technical report, elite pressing teams cross the 1000-mark in high-intensity runs per game. But it’s not chaos. It’s choreography. The press is triggered, not random—timed to bad passes, backward touches, or isolated defenders.

Brighton – The Blueprint of Control
Brighton – The Blueprint of Control

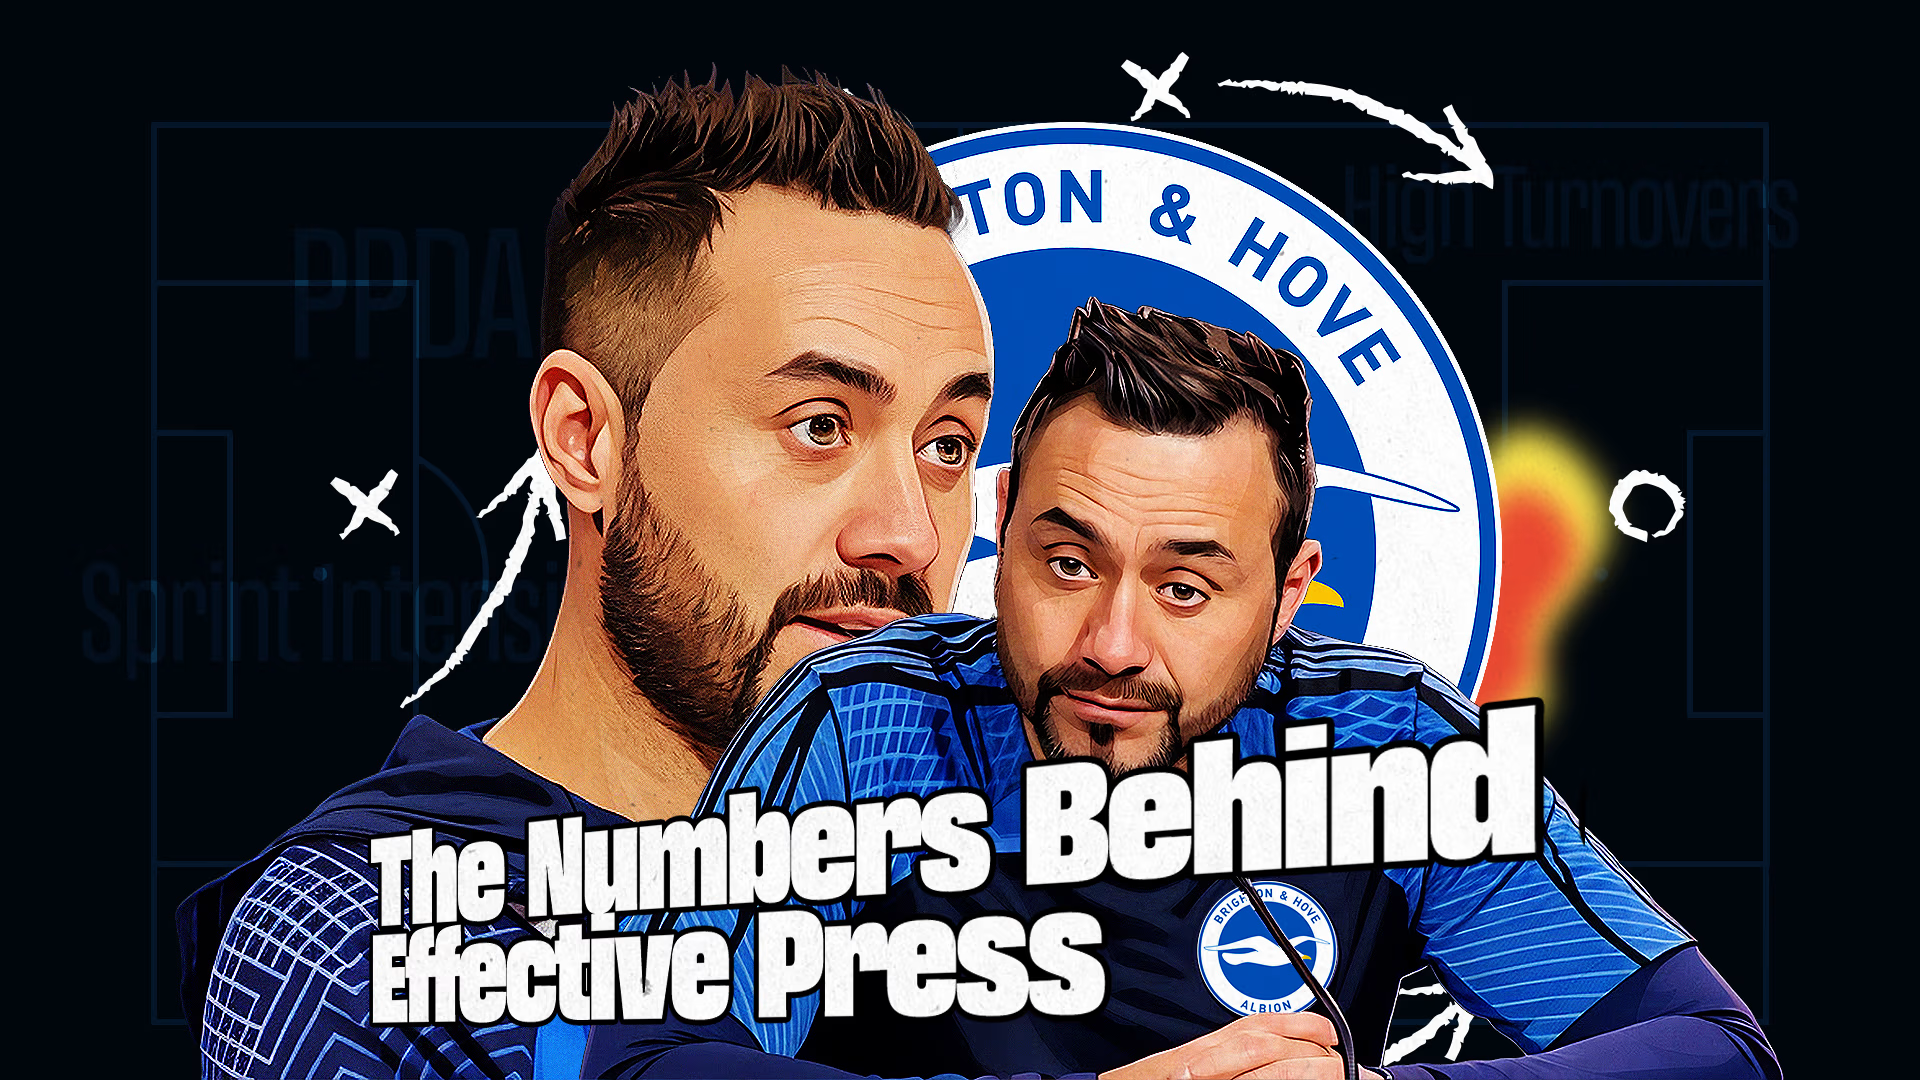
Roberto De Zerbi’s Brighton side from 2022–23 is a masterclass in pressing with intelligence. Their PPDA hovered around 9.3. Yet they held over 60% of the ball in most games. They didn’t press all-out—they waited, shaped the opponent’s passes, and struck at the right moment.

Brighton proved that pressing isn’t just for counter-attacking sides. You can dominate possession and still press with purpose. Their aggression was calculated, not chaotic.

The Data Says It All
The Data Says It All

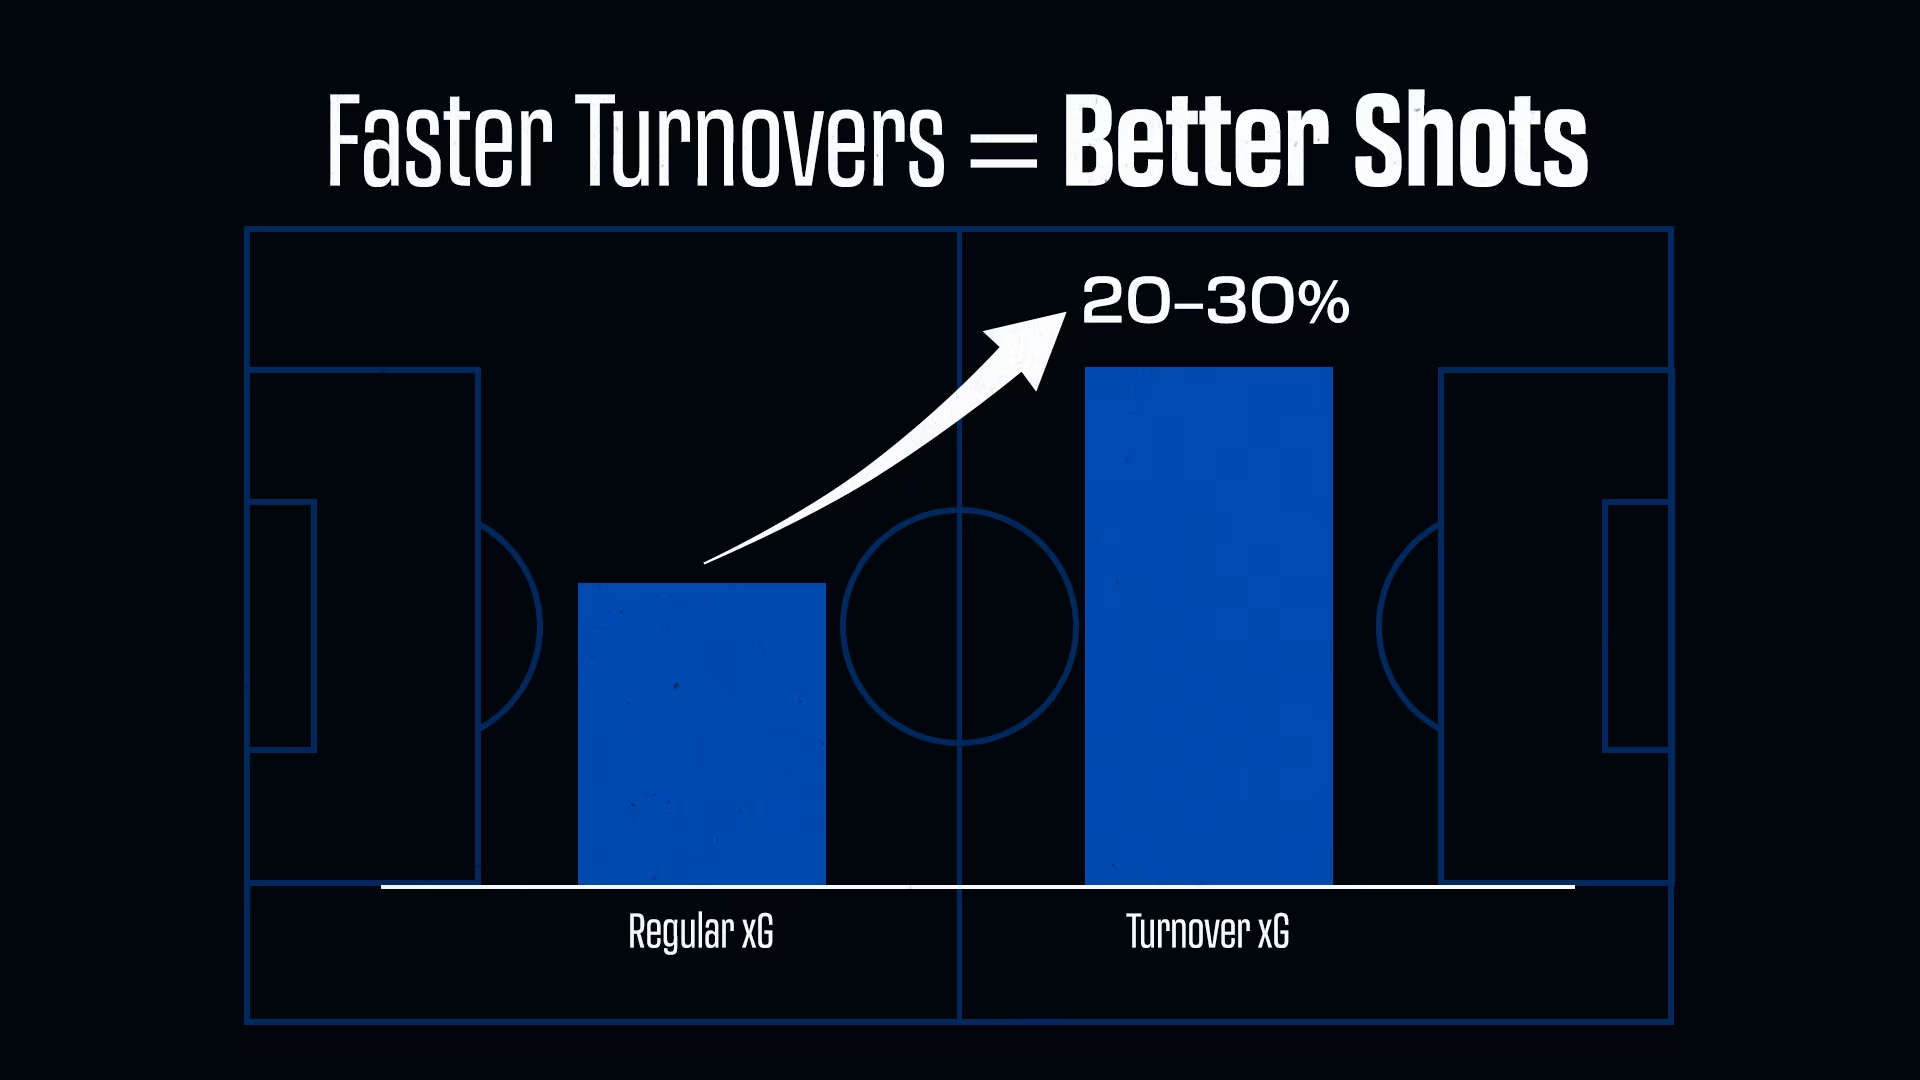
A 2023 StatsBomb study showed that shots taken within 10 seconds of a turnover carry 20–30% higher expected goals (xG) than regular open-play shots. The reason is simple: defenders are scattered, goalkeepers are unready, and attackers are already facing forward.

Winning the ball high up the pitch isn’t just about defense. It’s about instant threat and game control.

Final Whistle: Pressing Is the New Playmaker

In today’s game, pressing isn’t reckless energy. It’s precise execution. PPDA shows how fast teams act. High Turnovers show what they do with it. Sprint Intensity fuels the engine. When all three align, pressing becomes more than a tactic—it becomes the playmaker.

Pressing isn’t just about effort anymore. It’s about impact. And it’s winning matches.
Blog

Sideline Stories - Check Out What's Happening

View All Articles
StepOut vs Spiideo: Comparing Football Analysis and Performance Platforms
Football Analytics Tool

StepOut vs Spiideo: Comparing Football Analysis and Performance Platforms

Spiideo and StepOut sit in this space from different starting points. Spiideo brings together automated camera systems, video analysis, live production and data through its wider sports video platform. StepOut works from match footage, using AI to structure what happens on the pitch into football intelligence that can support match analysis, player development, scouting and wider club workflows. For clubs and academies comparing the two, the useful question is less about which platform offers more features and more about how each one fits into the way the organisation captures, analyses and uses football data.

StepOut vs Stats Perform (Opta): Comparing Football Analytics Platforms
Football Analytics Tool

StepOut vs Stats Perform (Opta): Comparing Football Analytics Platforms

StepOut and Stats Perform, through its Opta ecosystem, operate across many of these requirements, but they come from different starting points. StepOut begins with match footage. Its AI-driven workflow turns uploaded video into structured player, team and match information, which can then be used across tactical analysis, player development, scouting and wider football workflows. Stats Perform builds around Opta, one of the industry's most established football data operations. Its current football offering combines event data, tracking, physical information, AI-enriched metrics, recruitment tools, software and APIs. Opta Vision adds continuous positional data for all 22 players, synchronised with event data, across more than 80 competitions.

StepOut vs Driblab: Comparing Football Analytics and Scouting Platforms
Football Analytics Tool

StepOut vs Driblab: Comparing Football Analytics and Scouting Platforms

Football analytics platforms approach that question from different starting points. Some begin with match footage, some with large statistical databases, while others combine event data, tracking and specialist analysis to build a broader picture of performance. Driblab has built its reputation around football data, advanced analytics and scouting. Its current ecosystem includes Driblab XY for player and team analysis, optical tracking, physical data, Arrigo for combined event and tracking intelligence, Capture for turning uploaded match video into advanced data, Driblab Hub for scouting workflows, and consultancy services. Its platform covers more than 200 competitions and hundreds of thousands of players, with data available through its software, exports and API. StepOut approaches the problem from a different starting point. Its workflow begins with match footage. Clubs upload video, StepOut processes it through computer vision and proprietary machine learning and LLM models, and the resulting player, team and match information is made available through its TMS and wider football ecosystem. The platform extends into tactical analysis, player development, scouting, benchmarking and the Athlete App. The overlap between the two is significant, particularly around performance analysis, scouting and data-driven decision-making. The differences become clearer when looking at how each platform generates, structures and applies football intelligence.

Curious How This Would Work?

Access in-depth performance data, tactical intelligence, and AI-driven match insights for your team.

WhatsApp